Model Report
Data science nerd explains model report in simpler terms
Key Stats
Following are metrics of this XGBoost Binary Classifer (yes/no) model
AUC (ROC)
0.9897
High ROC means model always ranks real collisions above non-collisions
PR AUC
0.9222
High PRAUC means model stays accurate when finding positives even though positives are rare.
Log Loss
0.0330
Probability guesses are very close to the truth (lower is better)
Brier Score
0.00788
How close probability guesses are to reality (0 is perfect).
BSS
0.7920
~79% better than model that gives everyone the same probability as the overall collision rate
Accuracy
0.9906
~99% of predictions are correct (does not account for rarity).
Precision
0.9284
When model flags a collision, it’s right ~93% of the time.
Recall
0.8242
Model finds ~82% of all real collisions.
F1
0.8732
Single score showing a good balance between catching collisions and avoiding false alarms
Raw metric values (JSON)
{
  "AUC": 0.9896967068152173,
  "PRAUC": 0.9221800275998946,
  "LogLoss": 0.03295311660934501,
  "Brier": 0.007877794374411067,
  "BSS": 0.7920132663556981,
  "Prevalence": 0.03943125072909336
}
Curves
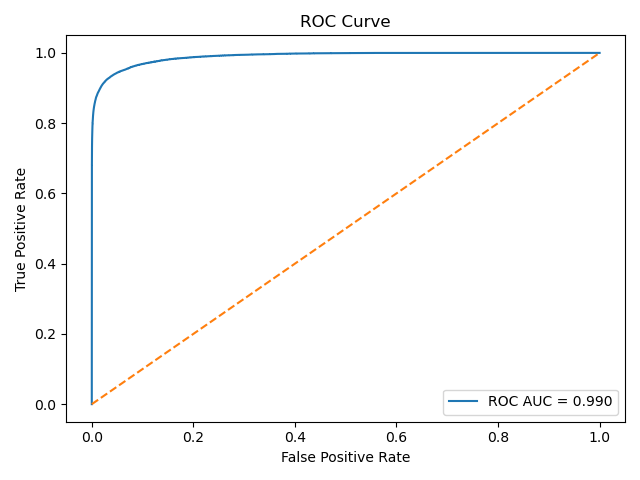
Picking a threshold:
- Lower threshold → higher recall, more false positives.
- Higher threshold → higher precision, more misses.
- Choose a threshold that minimises expected cost:
cost = FN_rate × Cost(FN) + FP_rate × Cost(FP).
Confusion Matrix
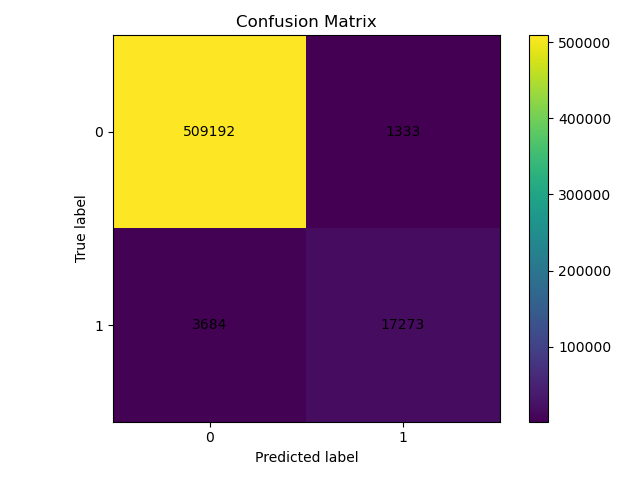
Classification Report
| Class | Precision | Recall | F1 | Support |
|---|---|---|---|---|
| 0 (no collision) | 0.9928 | 0.9974 | 0.9951 | 510,525 |
| 1 (collision) | 0.9284 | 0.8242 | 0.8732 | 20,957 |
| accuracy | 0.9906 | 531,482 | ||
| macro avg | 0.9606 | 0.9108 | 0.9341 | — |
| weighted avg | 0.9903 | 0.9906 | 0.9903 | — |
How to read this:
- Class 0 (no collision): precision 0.9928, recall 0.9974, F1 0.9951, support 510,525. Almost no false alarms and it correctly identifies most non-collisions.
- Class 1 (collision): precision 0.9284, recall 0.8242, F1 0.8732, support 20,957. Most alerts are real and it finds about 82% of true collisions.
- Accuracy: 0.9906 over 531,482 cases. Very high, but boosted by many non-collision cases.
- Macro average: precision 0.9606, recall 0.9108, F1 0.9341. Treats both classes equally and shows class 1 is harder.
- Weighted average: precision 0.9903, recall 0.9906, F1 0.9903. Weighted by class sizes, so it tracks overall accuracy.
- Support: the number of examples per class used to compute the metrics.
Feature Glossary
All predictors used by the model, grouped for clarity. Most come from OpenStreetMap; the rest are time and weather.
Time and CyclicalTemporal exposure and periodicity
dt_year,dt_month,dt_day,dt_hour— calendar parts.dt_is_weekend,dt_is_weekday— weekend vs weekday patterns.hour_sin,hour_cos— hour as a circle (23 close to 0).dow_sin,dow_cos— day-of-week cyclical.dom_sin,dom_cos— day-of-month cyclical.month_sin,month_cos— month cyclical.
WeatherVisibility, grip, and flow conditions
temp,dwpt— temperature, dew point.rhum— relative humidity.prcp,snow— precipitation, snowfall.wdir,wspd,wpgt— wind direction, speed, gusts.pres— pressure; sometimes aligns with fronts/storms.tsun— sunshine duration.coco— weather condition code.
Geometry and LimitsRoad design and speed environment
lanes_num_avg,lanes_num_max— lane counts.width_m_avg,width_m_max— carriageway widths.smoothness_score_avg— mapped surface quality.maxspeed_mph_avg,maxspeed_mph_max— posted limits.
Highway Class CountsMix of road functions in the cell
cnt_is_primary,cnt_is_secondary,cnt_is_tertiarycnt_is_residential,cnt_is_service,cnt_is_track_or_path- Counts of segments by OSM highway class.
Flow and Side ProvisionDirectionality, footways, cycle access
cnt_oneway_forward,cnt_oneway_bidirectional,cnt_oneway_reversecnt_sidewalk_both,cnt_sidewalk_left,cnt_sidewalk_right,cnt_sidewalk_nonecnt_bicycle_yes,cnt_bicycle_designated,cnt_bicycle_permissive,cnt_bicycle_no
Access and StructuresRestrictions and control points
cnt_access_permissive,cnt_access_destination,cnt_access_private,cnt_access_nocnt_is_bridge,cnt_is_tunnel— bridges and tunnels.cnt_has_barrier,cnt_has_amenity— barriers and amenities.cnt_has_bus_stop,cnt_has_mini_roundabout,cnt_has_speed_camera
Class Shares (within cell)Composition by length or count
share_is_motorway,share_is_trunk(sometimes shown as “truck”)share_is_primary,share_is_secondary,share_is_tertiaryshare_is_residential,share_is_service,share_is_track_or_path,share_is_foot_or_ped- These often sum to near 1; interpretations should consider their correlation.
Neighbourhood Context (r11_*)Windowed means and shares
r11_mean_maxspeed_mph,r11_mean_lanes,r11_mean_width_m,r11_mean_smoothnessr11_mean_cnt_has_signals,r11_mean_cnt_has_crossing,r11_mean_cnt_speed_camera,r11_mean_cnt_bus_stop,r11_mean_cnt_amenityr11_mean_cnt_is_primary,_secondary,_tertiary,_residential,_service,_track_or_pathr11_share_is_primary,_secondary,_tertiary,_residential,_service,_track_or_pathr11_share_oneway_forward,_bidirectional,_reverser11_mean_cnt_sidewalk_none,r11_mean_cnt_sidewalk_bothr11_mean_cnt_cycle_infra,r11_mean_cnt_cycle_lane,r11_mean_cnt_cycle_track
Nodes and AdminIntersections and areas
junction_degree— number of approaches at the junction.borough— administrative area (encoded for the model).is_junction— location is at a junction node.is_turn— is there a turn
Feature Importance
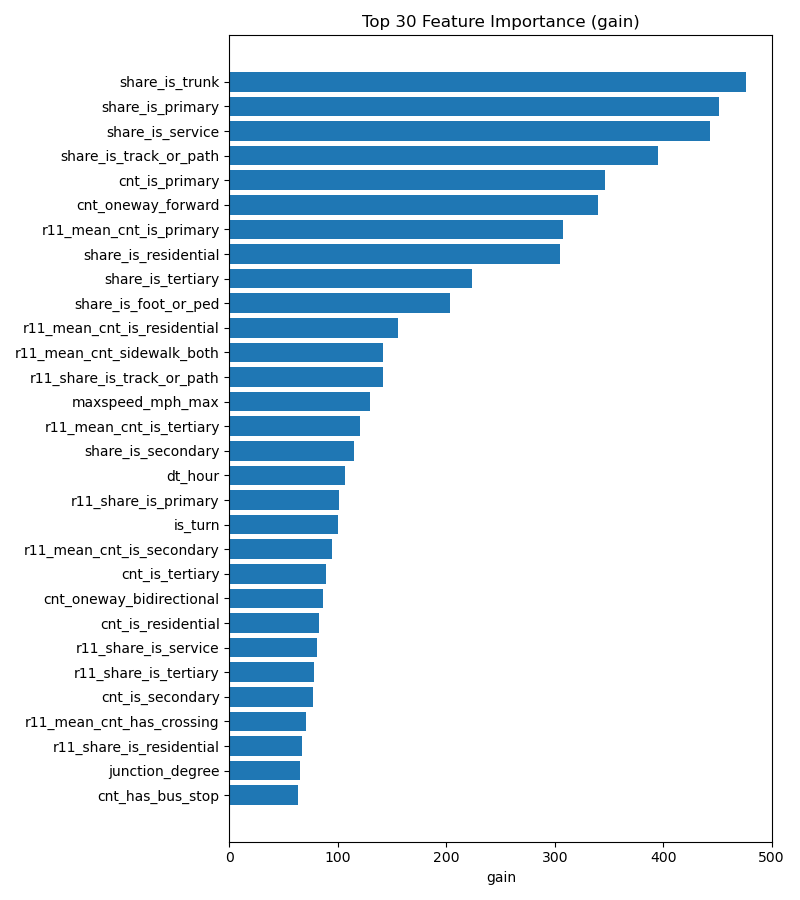
Model Notes
- It separates risky from safe cases very well, so most top alerts are genuinely risky.
- Current feature importance may be skewed toward fields that are present more often; better coverage could reshuffle what the model finds most informative.
- Performance holds up despite many more non-collisions than collisions, so per-class precision and recall are the key numbers to watch.
- Missing OSM fields likely cap performance in rarer scenarios, so more complete coverage would make the scores steadier.